Reverse Engineering and Replacing an Industrial 7-Segment Display – Part 2, Investigation
Published July 13, 2020
This is Part 2 of an N-part series. See also [Part 1].
In part one of this series, we began the process of developing a replacement for the LASCAR EM-4-LED 4-digit industrial 7 segment display. To recap: we mined the display's datasheet for all it we could, then opened up the device to reveal its component parts and continued to dig into their datasheets until we had a reasonably complete view of the device's functions. With the research phase complete, it's time to move into in investigation, and we'll think about how we might begin to probe an unknown device and its connections more specifically.
Author's Note: The post has been sitting fully written in my drafts since before things locked-down in mid-March, but was lacking a couple of illustrative screenshots/pictures of the signal-capture process. Since the pandemic's effects are still dragging on, I'm pushing this post out now with a couple of substitute images - they are noted below where applicable.
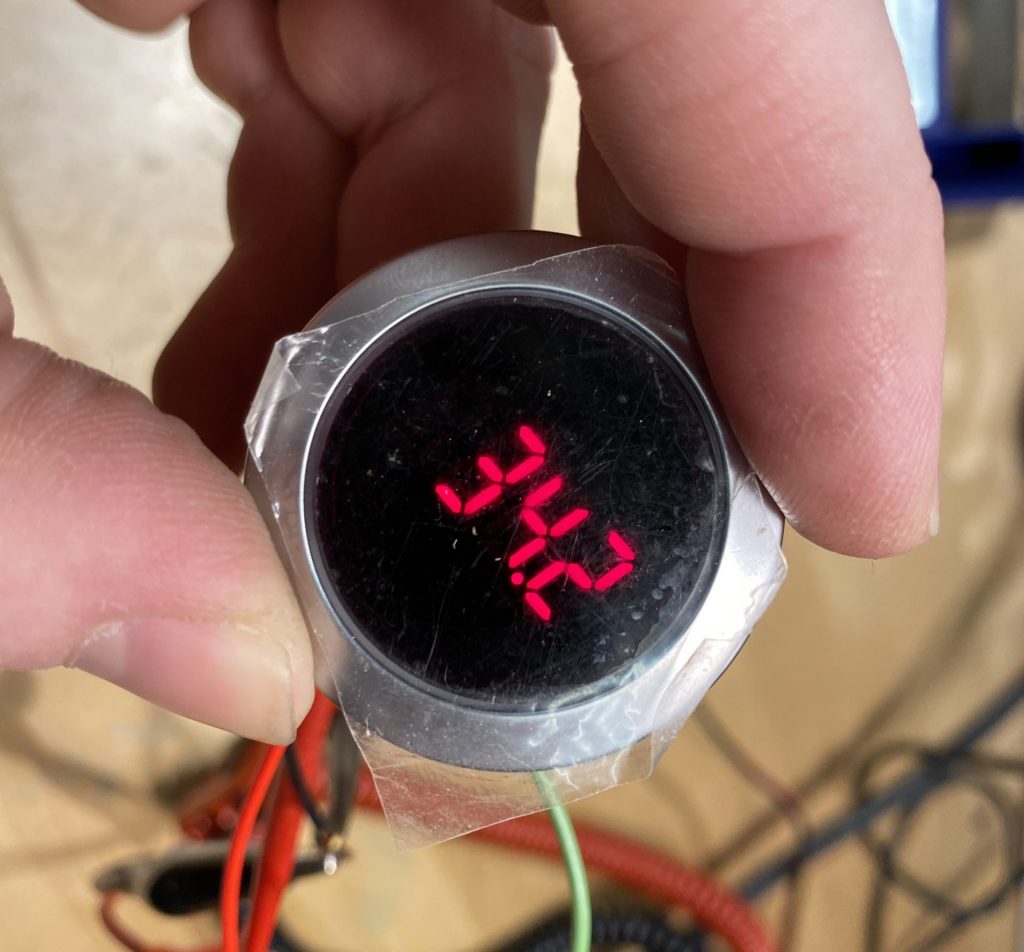
A refresher - this is the little display we are attempting to replace.
As you move into the phase of actually powering a device up and testing it, there are a few key parameters to keep in mind. Power and signal voltage levels are key - is this a 5V part, perhaps 3.3V, perhaps 12 or 24 or higher for industrial parts? And even if the device has a high or wide-range power voltage, any I/O ports may be more limited. This is why gathering as much data on-paper first is useful: to avoid letting the magic smoke out of the device-under-test before you get all its juicy secrets out.
Other specs worth keeping in mind are:
- Voltage level of outputs - can you safely probe all external pins with a TTL logic probe? Do you need to start with an oscilloscope to verify voltage ranges? Or even a multimeter?
- Output clock rates - does your instrumentation have the bandwidth to reveal useful information.
- Open-collector vs. current-source outputs - if you're expecting to see some output (for driving LEDs, relays, etc), do you need to supply external power to see if anything is actually happening?
Since we have this info (fairly) confidently in hand, let's dive into probing our hardware and see what new things we can learn.
Utilizing a Logic Analyzer
One thing that many folks pointed out in the comments of my writeup of useful electronics bench tools was the lack of a logic analyzer on my list. I confess before this project, I had never used one, nor particularly found a need for one. For many years, my primary electrical hobby was amateur radio (indeed, I had a whole separate blog for ham radio pursuits) - which, as a side note, is also a wonderful place to jump into learning about electricity in a very hands on way. Working in the handfuls-of-megahertz with analog signals, a 25MHz analog oscilloscope was a much more useful tool than something that operated only on digital logic. But for this particular project, while a scope is useful for verifying voltage levels and seeing whether a signal is present or not, the right tool for the job is a logic analyzer.
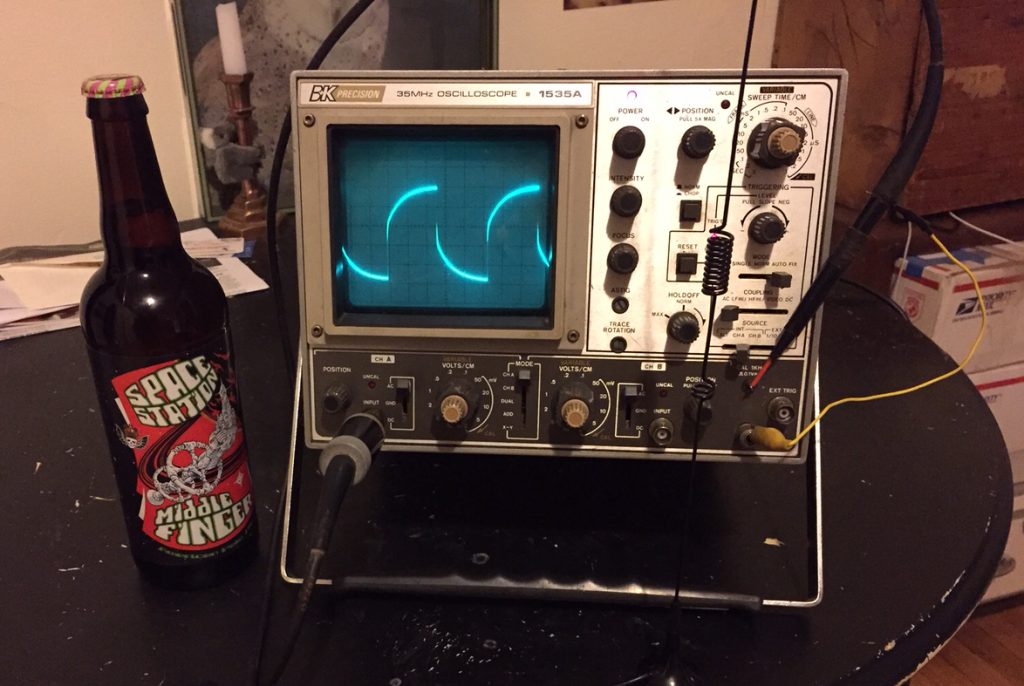
The old analog oscilloscope that got me through years of Ham Radio adventures
A logic analyzer is a piece of digital test gear that reads the voltage on two or more input connectors and creates a digital representation of the logic-levels of the voltages present over time. So where a digital oscilloscope records and displays analog voltages over time with some degree of precision, a logic analyzer is only interested as to whether the voltage is above or below a threshold, so as to be a logic high or logic low (typically 0v-12v, 0v-5v, 0-3.3v).
For talking to some other nerds and receiving some feedback online, it seems like the standout stars in the relatively-low-cost logic analyzer space are the offerings from Saleae and the Analog Discovery and Digital Discovery from Digilent. All of the above are modules that plug into a computer via USB for their control and display capabilities, so they cannot be used as stand-alone devices in the field. While some mid-to-high-end oscilloscopes also have signal-analysis capabilities built in - these are often listed as "mixed signal" oscilloscopes - those are a bit beyond my current needs at the moment. And in fact, while the Digilent products have had my eye for awhile, as a place to get my feet wet with signal analyzers for this project, I wanted to verify that this would be a useful tool before I committed my department's funding to a few-hundred-dollar purchase.
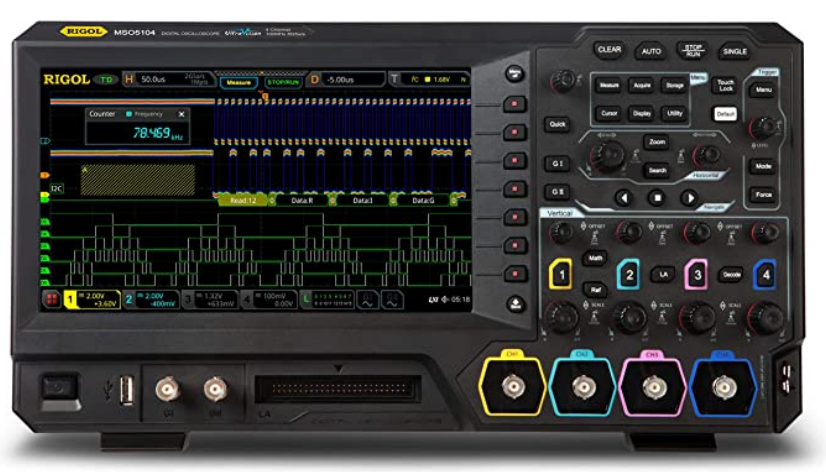
A fancy Rigol scope with logic analyzer functions - note the multipin connector under the display.
I ended up with a $25 8-Channel Sparkfun Logic Analyzer, which handles 3.3V and 5V signals with a sample rate of us to 24 MHz. This nominally means it can handle digital signals up to about 12 MHz, but in practice, something somewhat lower would be a safer choice. Since the LASCAR display we're working on has a nominal data rate of 500 KHz, this should be plenty for my purposes.
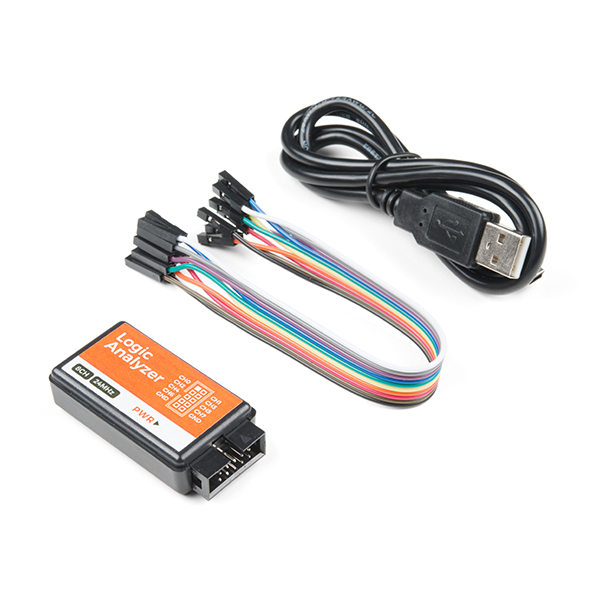
The Sparkfun Analyzer seems to essentially be a branded version of the many inexpensive logic analyzers floating around Amazon - all of which pretty much will work with the open-source logic analysis software PulseView, which is itself a graphical frontend for the command line program Sigrok. While PulseView doesn't allow access to all of Sigrok's many capabilities, its a significantly more approachable way to get started with these devices in my opinion.
to compile and install PulseView on Ubuntu · 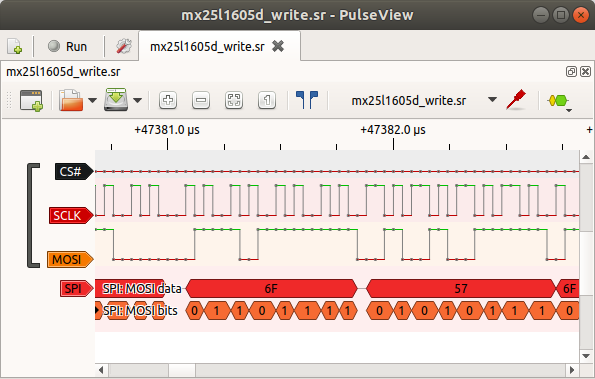 Pulseview can capture samples and decode them visually for you.
Sparkfun has already written up a great Getting Started with Sigrok, Pulseview, and the Logic Analyzer tutorial, so I won't try to duplicate their work here. Suffice to say, after getting the software installed, you attach the ground probe on the analyzer to a ground point on the circuit you're probing, and attach one or more signal probes to the signal lines you're like to test. After configuring the sample rate at which you want to capture data points and how many points to capture, you "run" the analyzer, which then then a few seconds to minutes capturing the number of points you selected. After capture, you can select one of a number of "decoders" that attempt to turn the individual high-or-low, one-or-zero datapoints into a structured view of what data contained therein. For example, if you're probing what you think is a serial UART stream, the UART decoder will give you a view of the data as ASCII characters being transmitted over the UART, which is much easier than looking at pure sample points.
Here's a look at the data and power lines going to the existing LASCAR display:
(Getting this picture has been pre-empted by a global pandemic! A picture will be here when I can get back in the building someday.)
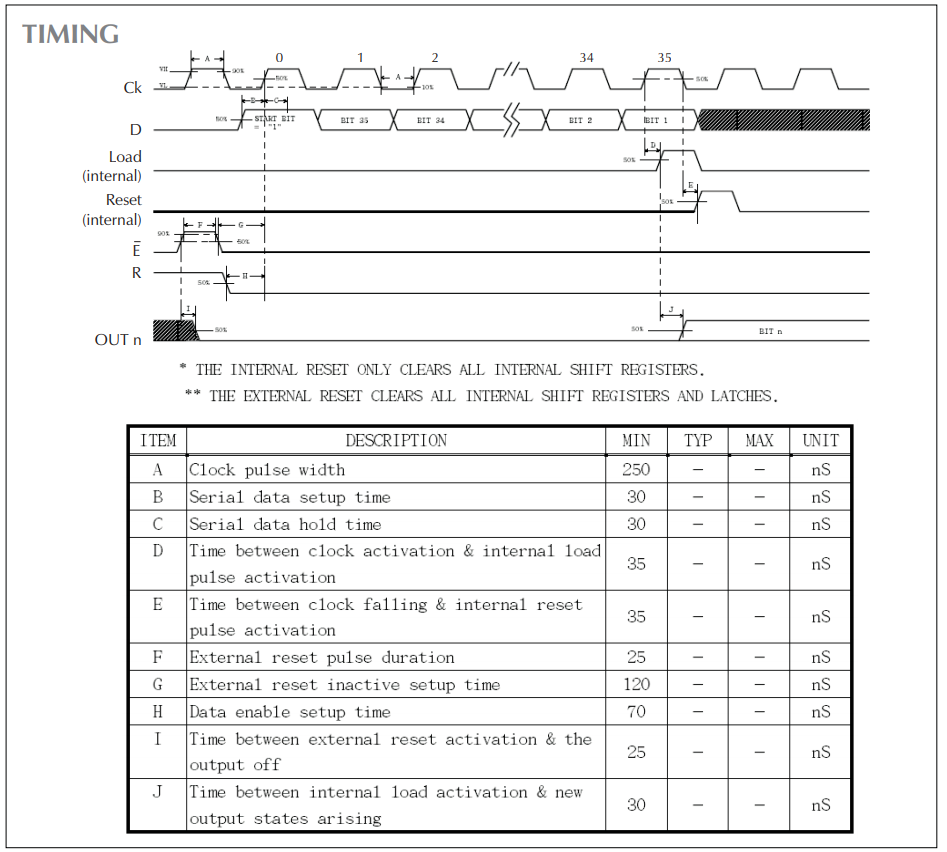
What a nice set of labels! The presence of the clock and data lines matches with our expectations, since last time we spotted a shift-register built into the brains of the EM-32 display. The shift register will "clock in" or take in one bit of data from the data line each time it transitions, either from low-to-high or high-to-low. So we should expect to see these lines changing in alternation - first, the data line will go low or high to establish the next bit of data, then the clock line will be pulled low or high to tell the shift register to take-in this bit of data.
Or at least, that's what I would expect, given the schematics of the EM-32 that we were looking at last time. Probing the signals will hopefully allow us to confirm this. So, let's hook up a the signal analyzer's ground to the GND wire and channels 1 and 2 of the analyzer to the CLOCK and DATA lines, here's what we capture:
]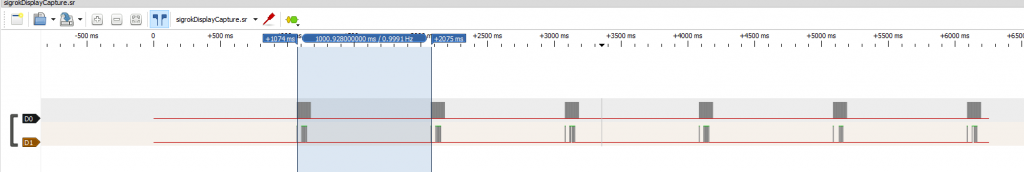 This is a substitute image of a different capture - the actual image is inaccessible due to pandemic conditions. But the capture would look much like this.
The first thing we note is that the data rate here is nowhere near the 500KHz rate that the datasheet says we can tolerate - we're seeing about 40 bits of data at a rate of roughly 1KHz, in bursts about 10 times a second. So we can turn our data capture rate waaaay down from its maximum 24 MHz. Which is great. Applying the SPI decoder to this data (which has a similar clock-and-data-lines structure to what we expect) allows us to see a view of the individual 1's and 0's that make up the stream of bits coming from the PLC.
]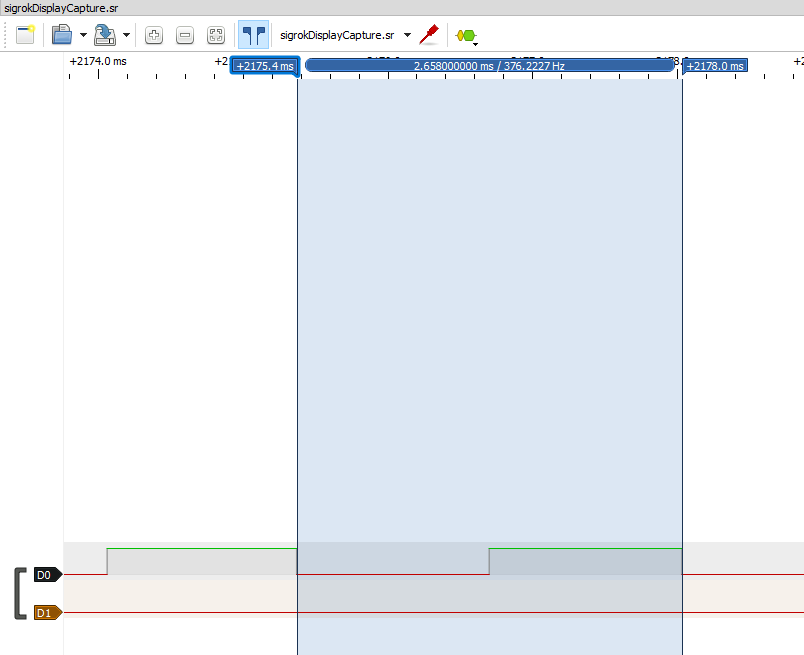 This is a substitute image of a different capture - the actual image is inaccessible due to pandemic conditions. But the capture would look much like this.
Comparing this bitstream with the timing diagram we saw last time, we thankfully see things lining up pretty well - we can see the initial clock pulse and start data bit, which tells the display to begin expecting data, following by 35 bits of data more. The PLC then pauses for approximately 100ms before sending more data.
The two major takeaways from our logic-analyzer work are:
- The bitstream coming from the PLC is as-expected given what we learned from the datasheet, and
- Its datarate is at most 1KHz, in bursts about 10 times a second.
This will help us develop our testing solution - knowing that we have reasonable data rates means that we don't need to throw anything particularly fancy at this problems in term of hardware.